
If you’re running AB tests, you’re surely running into concepts like “95% confidence intervals” and the “Null hypothesis”. And you’re already using “p-values”, too, though you may not know it.
Unfortunately there’s a great chance you’re using them wrong, and it’s having an impact on your AB testing program!
Here is a business person’s overview to help you avoid common problems and misunderstandings about p-values.
P-values are a common way to determine the statistical significance of a test. The smaller it is, the more confident you can be that the test results are due to something other than random chance.
A common p-value of .05 is a 5% significance level. Similarly, a p-value of .01 is a 1% significance level. A p-value of .20 is a 20% significance level.
If you prefer visual interpretations, what the p-value quantifies is the wing(s) of a distribution if the experiment were repeated many times. Here’s a classical bell curve:
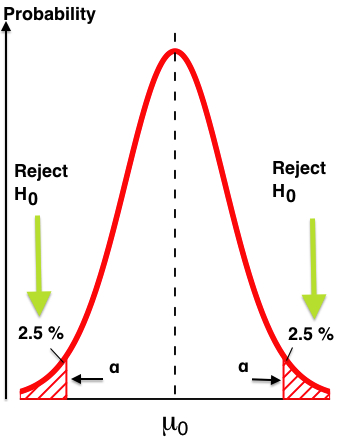
Repeating the experiment multiple times, we’d expect to get slightly different results each time, distributed around some central value. “What does it take to be an outlier?”, you might ask yourself, or, “what sort of test result might I expect to see such that I’d start to think I’ve got something significantly different on my hands?”
In the above, a test result significant to look at would be one that yields a result in the outlying red areas shown on either side of the curve. In this example, p=.05 (5%) so we split that and look at 2.5% on the left and right extremes. More commonly we’re looking not just for “different from expected” but for “improvement over expected” — conversion rate improvement comes to mind — so we concentrate all of our investigation to the right side and expand it from 2.5% to a full 5.0%
Some people prefer to think in terms of a Confidence Level. This is simply the p-value’s complement, 100-p; thus p=.05 corresponds to a confidence level of 100-.05 = .95 = 95%. Similarly p=.01 corresponds to 99% confidence level, p=.20 corresponds to 80% confidence level, etc.
This lets us examine a range of values: what is the interval, surrounding that central value of all the test results, within which we would have 95% or 99% or etc confidence the true value is? Anything outside this area can be considered as statistically different and possibly significant.
We move now to how this gets woven into AB testing, because that’s where the real impact comes in. What if we ran an AB test that looked like this:
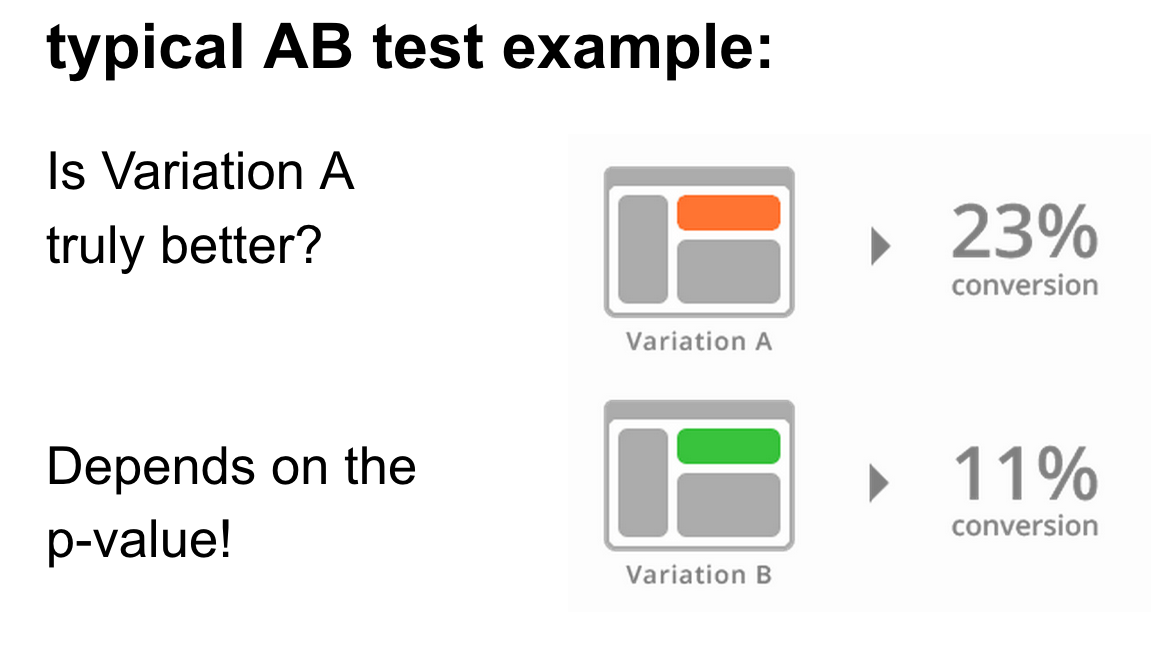
Let’s pretend Variation A is an existing treatment and is thus a Control, and Variation B is some new treatment that we hope will do better.
Superficially, above, it looks like A is the winner, but we’d have to know a bit more to really say that. Here’s three different confidence intervals, all corresponding to a p-value of .05, which might change our mind:
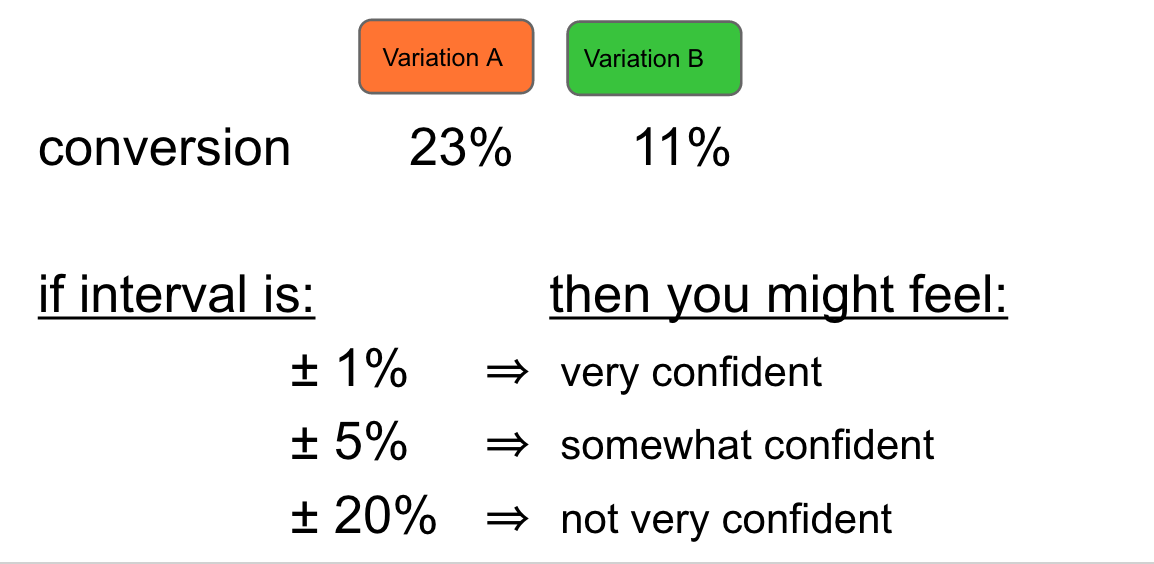
If the 95% confidence interval (i.e., p=.05) of orange Variation A is 23% +/- 1%, that would be a pretty tight fit, so we could feel good that the ‘true’ conversion rate for A is somewhere between 22% and 24%; this is far enough away from green Variation B’s 11%, (with its own confidence interval, I might add) that we’d happily call A the winner. Well, assuming there’s not some systemic bias going on.
As for the middle case, this corresponds to Variation A having a conversion rate somewhere between 18% and 28%, so yeah that feels like it’s still better than green Variation but we might not be quite so confident as the example above.
On the other end of the range, if the 95% confidence interval of Variation A is 23% +/- 20%, well then we really have very little confidence to say anything much at all, being that the range for Variation A is 3% to 43%. Maybe A is better than B but there’s so much overlap, who really knows?
So, as you can see, depending on that confidence interval, we might take action to implement orange Variation A over green Variation B, or we might throw our hands up and figure a better test is needed to really tease anything meaningful out. Or somewhere in between. If we tighten the p-value (making it smaller), we have a more significant result when it happens, but it comes at the cost of needing more traffic to get to that level of significance. When we loosen the p-value by making it bigger we lessen the relative amount of traffic needed to get to that level of significance but we might be so loosey-goosey on the significance that it’s not very actionable.
And that was with p=.05, a fairly common value, particularly for AB testing online. In more stringent conditions, for example medical studies of a leukemia drug, where the cost of being wrong impacts people’s lives, it’s far more common to see p-values of .01 or .001. Again, the smaller p-value you accept, the more significant the result will be when a change is detected.
In the example above, I went out of my way to pick an example where the conversion rates between the two Variations was so far apart that it’s mostly clear what step to take next. However, the messy reality of online testing is that most tests aren’t so clean cut, and the actionability of what-the-heck-do-we-do-with-this-test leads ordinary business people to use p-values incorrectly, to their AB testing program’s detriment.
——————–
Here are five problems and challenges with using p-values which are almost certainly impacting your ability to maximize your testing and optimization efforts:
Problem #1: P-values are for a Null Hypothesis
A Null Hypothesis is just a fancy way of saying “actually, there is no difference”.
The purpose of the p-value is to give some measure to the concept “how likely is this data given the null hypothesis? Is the difference we see in B compared to A due to nothing more than random chance?” And that’s all the p-value is designed to do. Nothing more.
Thus, p = .05 (5%) means we’re accepting that 1 out of 20 times we do this test, we’ll see some difference between A and B when there really is no difference at all (called a “false positive”). The true error rate is actually far worse (more on this in a moment)
Take-away: Write out a null hypothesis for your test before the test begins; that is what you’re hoping to disprove with a low p-value. And while you’re at it, declare a p-value (or a Confidence level) that you want to use as a metric.
Problem #2: This tells us less about our alternative, B, than you think
The only thing the p-value told us was how confident to be about the null hypothesis. That is, is it worth looking further into this difference between A and B, or is it just noise? P-values tell us nothing much about any alternative hypothesis, and it surely doesn’t tell us if B is a great idea.
This may seem counter-intuitive. But consider: if I ask you, “did it rain today?” and you respond “no, it didn’t rain”, I can’t really conclude that it snowed. Yes, it might have snowed. It might also have been clear skies all day. Or maybe it sleeted, a sort of rain/snow mix. Anyway, the point is: don’t run off to conclusions about the alternative hypothesis just because you get a singular decent p-value that let you discard the null hypothesis.
You may find it useful to consider a so-called “AA test”. This simple trick can help keep yourself honest. What would you expect from an AA test? Your instincts tell you an AA test should show no difference between Variation A and, well, Variation A. Duh. If you did see a difference, you’d chalk it up to just random chance between the group that saw the first A and the group that say the second A. So don’t give B any more import than that.
[As an aside, running an AA test represents very small risk. You might incur operational costs, though, if you pay for your AB testing software based on traffic sent through the test.]
Take-away: AB testing is a game of RBIs, not grand slams (despite what conversion consultants will tell you).
Problem #3: A p-value is not the probability you think it is
A common mistake is to consider the p-value as the probability that the test result is the number reported. It’s not. So statements like the following are you fooling yourself: “Oh, the orange version A has a 5% (p=.05) chance of being 23% wrong”. Or, again using the Confidence Level, “Orange version A’s conversion rate has a 95% of being right”. The mistake is in the meaning of “right” and “wrong”.
“Being wrong” means this test caused us to reject the null hypothesis when we should have accepted it. Or put it this way: “we fooled ourselves into thinking we had a winner and in reality we should’ve just stuck with the Control”. So better ways to express this probability is, we have a 5% (p=.05) chance that we will interpret this result as significant when it really wasn’t, or, “we have a 95% confidence that the true conversion rate is somewhere inside the Confidence intervals”.
Why is a p-value not a probability? Three great reasons:
- first, we’re looking for the “true” value for the whole population — in our example, the “true” conversion rate, and we’re estimating it by looking at samples drawn from the population. Either that true value is within the confidence interval, or it is not. You can’t be a little bit pregnant!
- second, p-values are calculated as if the null hypothesis is true and the difference we’re seeing is due to random chance. It doesn’t ask if it’s true, it assumes it already is, and then quantifies our confidence that this assumption is right.
- third, a low p-value — which is what we want — can’t tell the difference between the case where we really have a true null hypothesis situation but the sample is off, versus the case where we have a false null hypothesis due to the data.
Take-away: Your chance of coming to the wrong conclusion from a single, isolated test is far higher than you think. Be careful.
Problem #4: Playing “tag” with your p-values
Resist the urge to call a test the moment a particular p-value is reached. I call this “tagging”, as in the game of “Tag, you’re it!”. “Hey we ran the test and got p=.05 (95%) the first day! We can stop the test and declare a winner! Yay us!”
In fact, “peeking” this way and calling the test as soon as you hit 95% is almost a sure way to get bad test results. Resist the urge to peek; you’re biased enough already.
Consider: if you stop the test when you hit 95% how do you know you weren’t about to get a whole slew of additional data that would’ve moved the confidence needle back down? This is a variation on Problem #3 above, but this game of “tag” is so prevalent in business settings, that it becomes a fetish — it almost as if having spent so much time thinking about the test and setting it up, everyone is in a rush to complete the test, take credit for the winners and silently ignore the losers, and move on to the next test.
Take-away: Tagging is a great way to fool yourself. Regularly run AA tests — as often as once a quarter! — declare a winner of the test as soon as you hit p=.05, and then let the test continue running. You’ll be surprised how often the other variation you didn’t call wins.
Problem #5: Don’t give too much weight to any single test
OK, so you resisted playing tag with your tests, and you’ve stopped thinking that p=.05 means you’ve got a 95% chance of being “right”. What is an actual estimate that you’re wrong?
The true error rate is typically much higher than the p-value. Some studies describe the true false positive rate for p=.05 tests to be close to 25-50%, and for p=.01 to be 7-15% . Yikes! This should scare you, or at least make you cautious.
If the effect is true, the result should be reproducible. If you can’t wait to implement the supposed improvement, at least make a calculation as to what the financial cost of implementing wrongly is and balance it against the opportunity cost of not making the change. Maybe it will help justify the resources to do a follow-up test. Or maybe it will be worth simply re-jiggering what percentage of your traffic gets the new treatment.
Run successful tests multiple times. The more impactful the experimental results might be to your company, the more important it is to re-run the test again (and even “often”). Likewise if you have a failed test, consider putting it back in your inventory of test ideas to be run again at some future date (again, weighted by how relatively “big” you feel the underlying idea is to your team). You’ll be surprised how often you can save a decent idea this way.
Take-away: All successful tests from from unsuccessful “parent” tests. Embrace a healthy dose of failed tests as the cost of finding the winners.
Summing Up
Thomas Fisher, who invented p-values, once said:
‘A scientific fact should be regarded as experimentally established only if a properly designed experiment rarely fails to give this level of significance’
In other words, be careful. Fisher never intended p-values to be anything other than a useful way to determine if the data merited a second look.
Recognize you have a bias, always. This is particularly true in business settings. You’re already biased to B: If you really thought A and B would show no difference, you’d probably be running a different test. Your brain is primed to fix on any improvement and to ignore evidence against as “just noise.”
Since the chance of big change from a test is fairly low — one runs out of low-hanging fruit fairly quickly — any test that results in big improvement (100%! 500%! 1000%!) probably needs a healthy dose of skepticism . It’s more likely to be due to something odd.
————–
In an upcoming post, I’ll delve into Bayesian AB testing and how it leverages a more intuitive approach to avoid many of the problems inherent to classical frequentist statistics (including the p-value we just covered)